What happened in 2007?
It's the damn phones!
If you're curious about why so many charts bend around 2007, this page is for you. Inspired by WTF Happened in 1971, I wanted to make a site that collects charts showing a cluster of strange inflection points around the late 2000s.
Starting in the late 2000s and accelerating through the 2010s, a series of troubling trends emerged. Measures of well-being (happiness and life satisfaction) began to soften. Youth mental health entered a crisis period, with depression, anxiety, and self-harm rising sharply. At the same time, metrics of cognitive performance and academic achievement, such as international test scores and measures of fluid intelligence, appeared to stagnate or decline after decades of progress. Labour productivity growth, a cornerstone of economic prosperity, slowed to a crawl.
We had major shocks in that window, including the Great Recession and COVID-19, and those clearly matter. My hypothesis, though, is that the introduction of the iPhone—and the broader shift into the modern mobile age—has had a huge impact on attention and, downstream, on life outcomes across the globe.
This is not an attempt to say these trends are monocausal. Correlation != Causation. But it is, at minimum, striking that so many charts line up around 2007, with slopes that steepen as smartphone adoption increases.
This is a work in progress. I want the argument to get stronger over time. It is probably a little weaker than it should be right now, but I think it's obvious something interesting has happened since 2007.
Update Log
IQ Scores
The "reverse Flynn effect" refers to a recent decline or plateau in average IQ scores in some developed countries, contrasting with the historical rise in IQ scores known as the Flynn effect. This trend, sometimes called the negative Flynn effect, is attributed to factors like changes in education, lifestyle shifts such as increased screen time, and other environmental influences
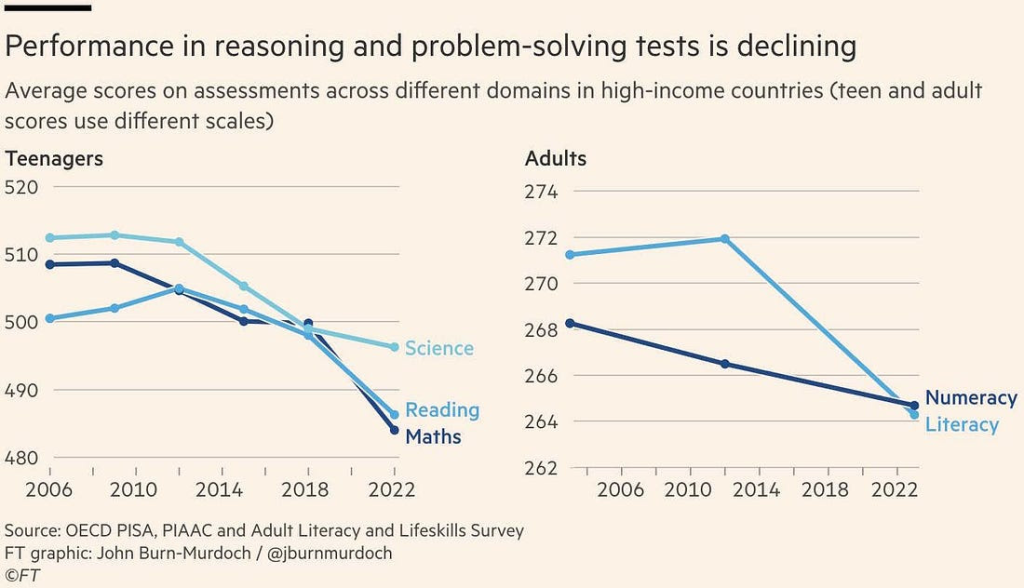
Figure 1: Reverse Flynn Effect
Increase in smartphone adoption
Smartphones achieved market saturation much faster than technologies before it.
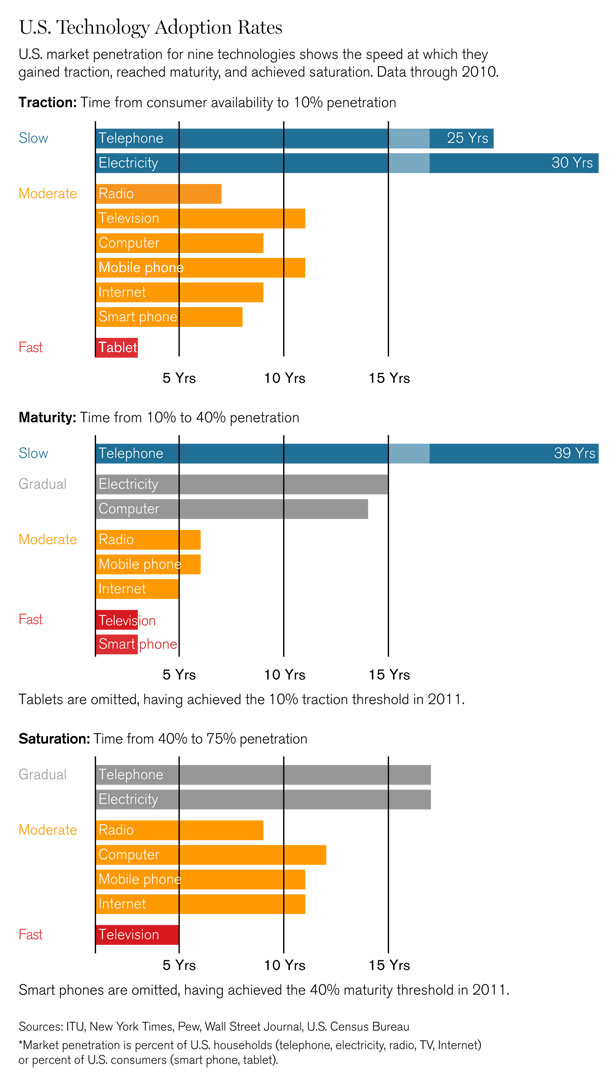
Figure 2: Technology Adoption Rates
By 2014 there was over a billion smart phone devices.
From 2014 to 2024 that number increased to 4.88 billion (source: https://www.bankmycell.com/blog/how-many-phones-are-in-the-world)
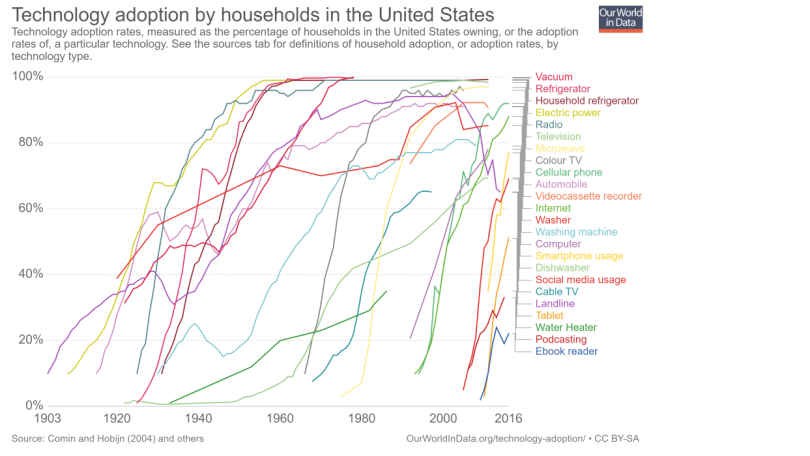
Figure 3: Technology Adoption Rates
Around 60% of the world's population has a smartphone. In some markets smartphone adoption is at 82.2% - which is to say, these devices are ubiquitous and especially so in advanced nations.
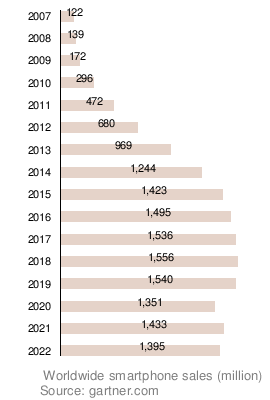
Figure 4: SmartPhone Sales
Internet traffic is now primarily coming from mobile devices. It took a while for this to flip, but the act of "going online" went from one where you sat at a desktop, to one of being constantly online, connected 24/7/365.
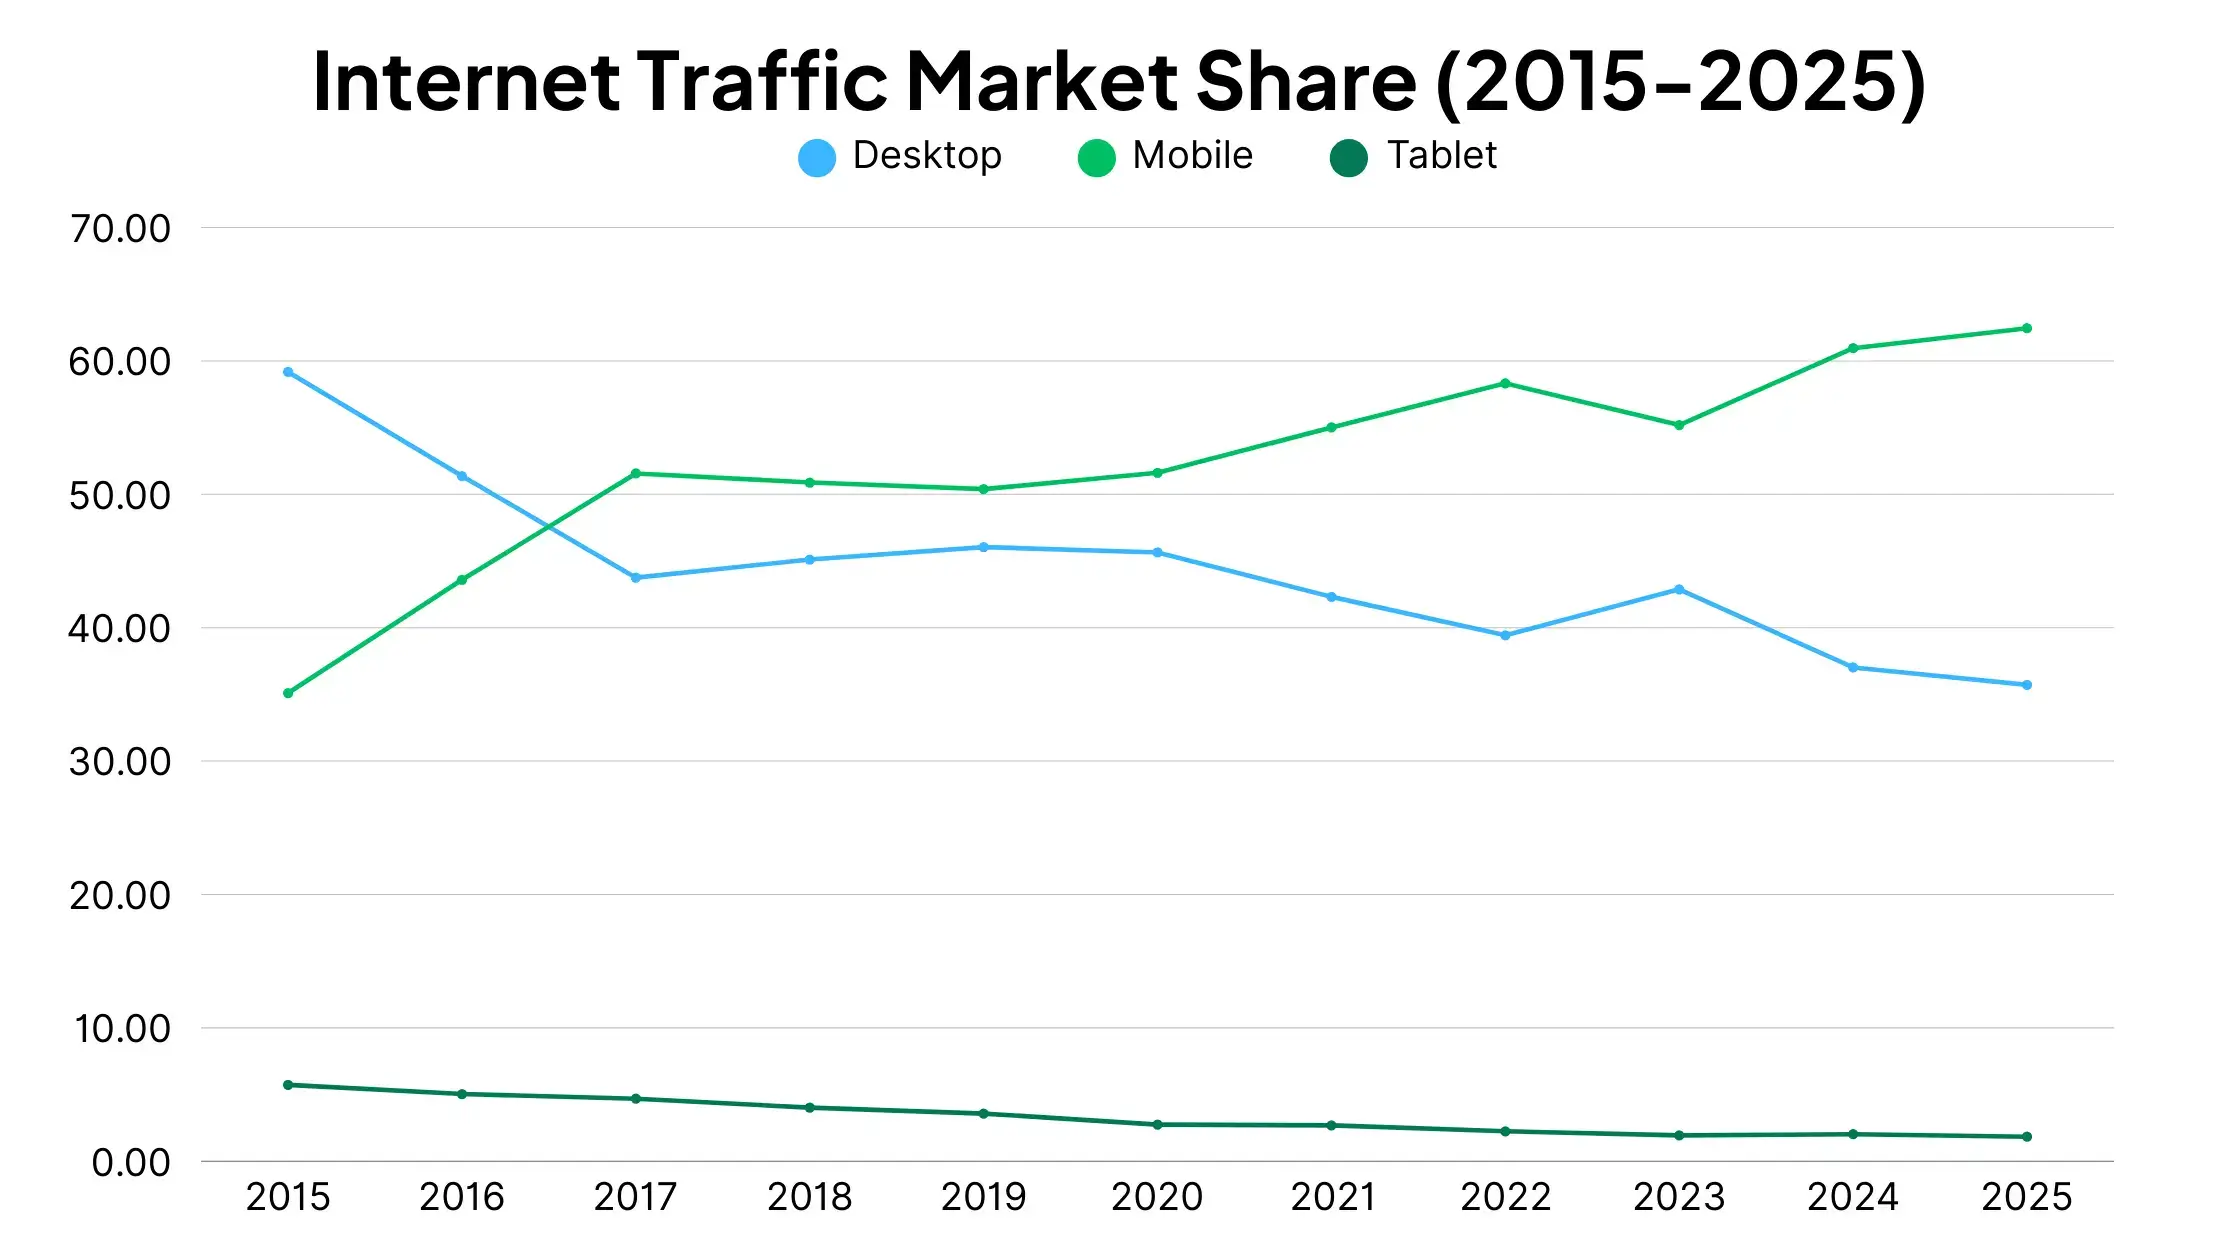
Figure 5: Traffic Trends over time
Test Scores
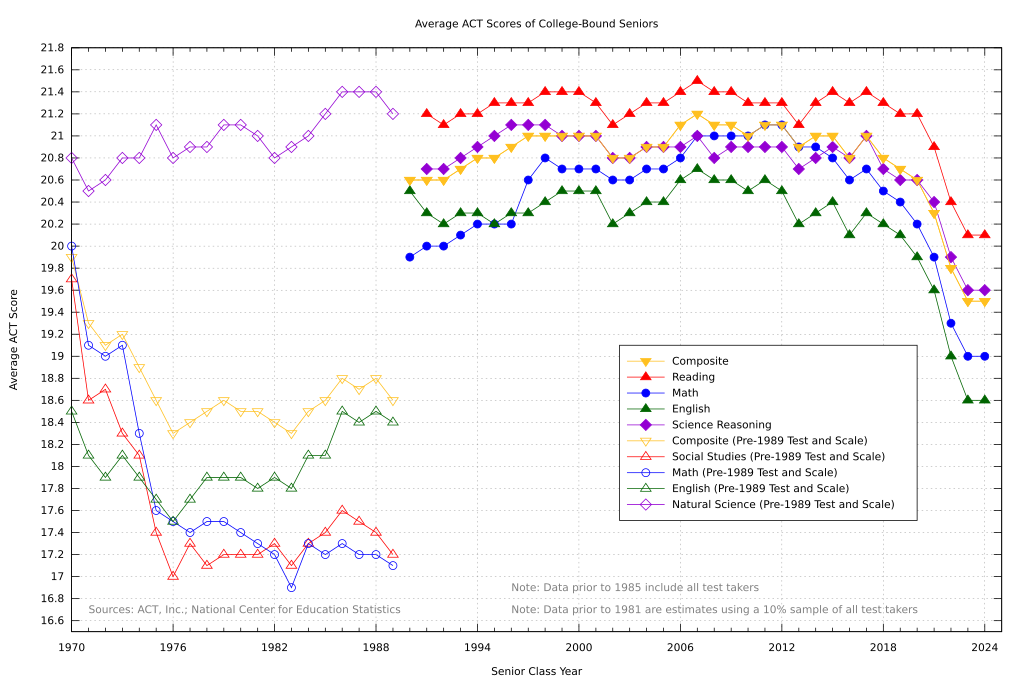
Figure 6: ACT Scores
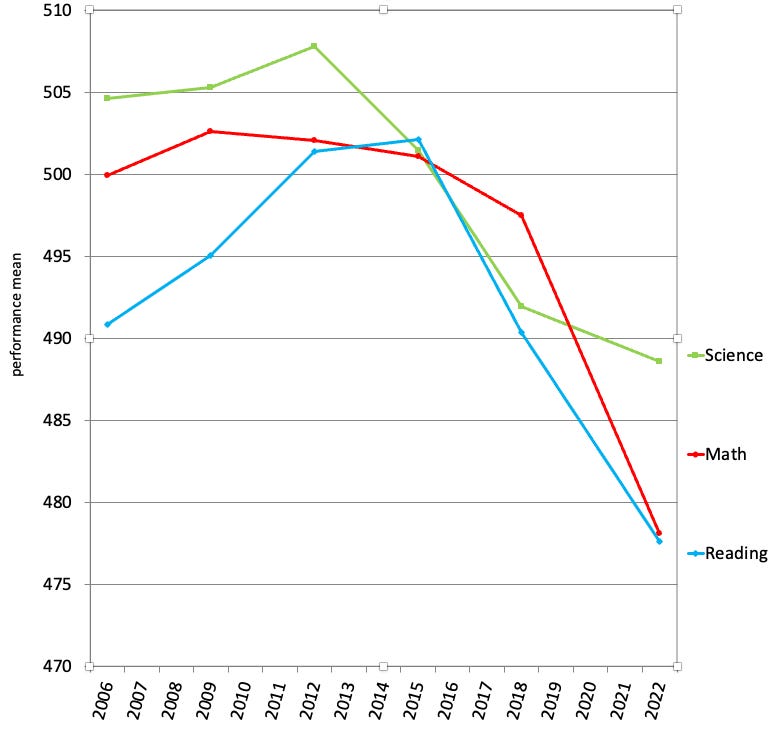
Figure 7: SAT Scores
Internet Addiction
Figure 8: Internet Addiction
Sleep Abnormalities
Between 2010 and 2021 there was increase of self-reported sleep problems in age groups 15 to 45 of 15% (34 -> 49%). In that time there was a 10x increase in melatonin usage (source: https://www.science.org/doi/10.1126/sciadv.adw1227)
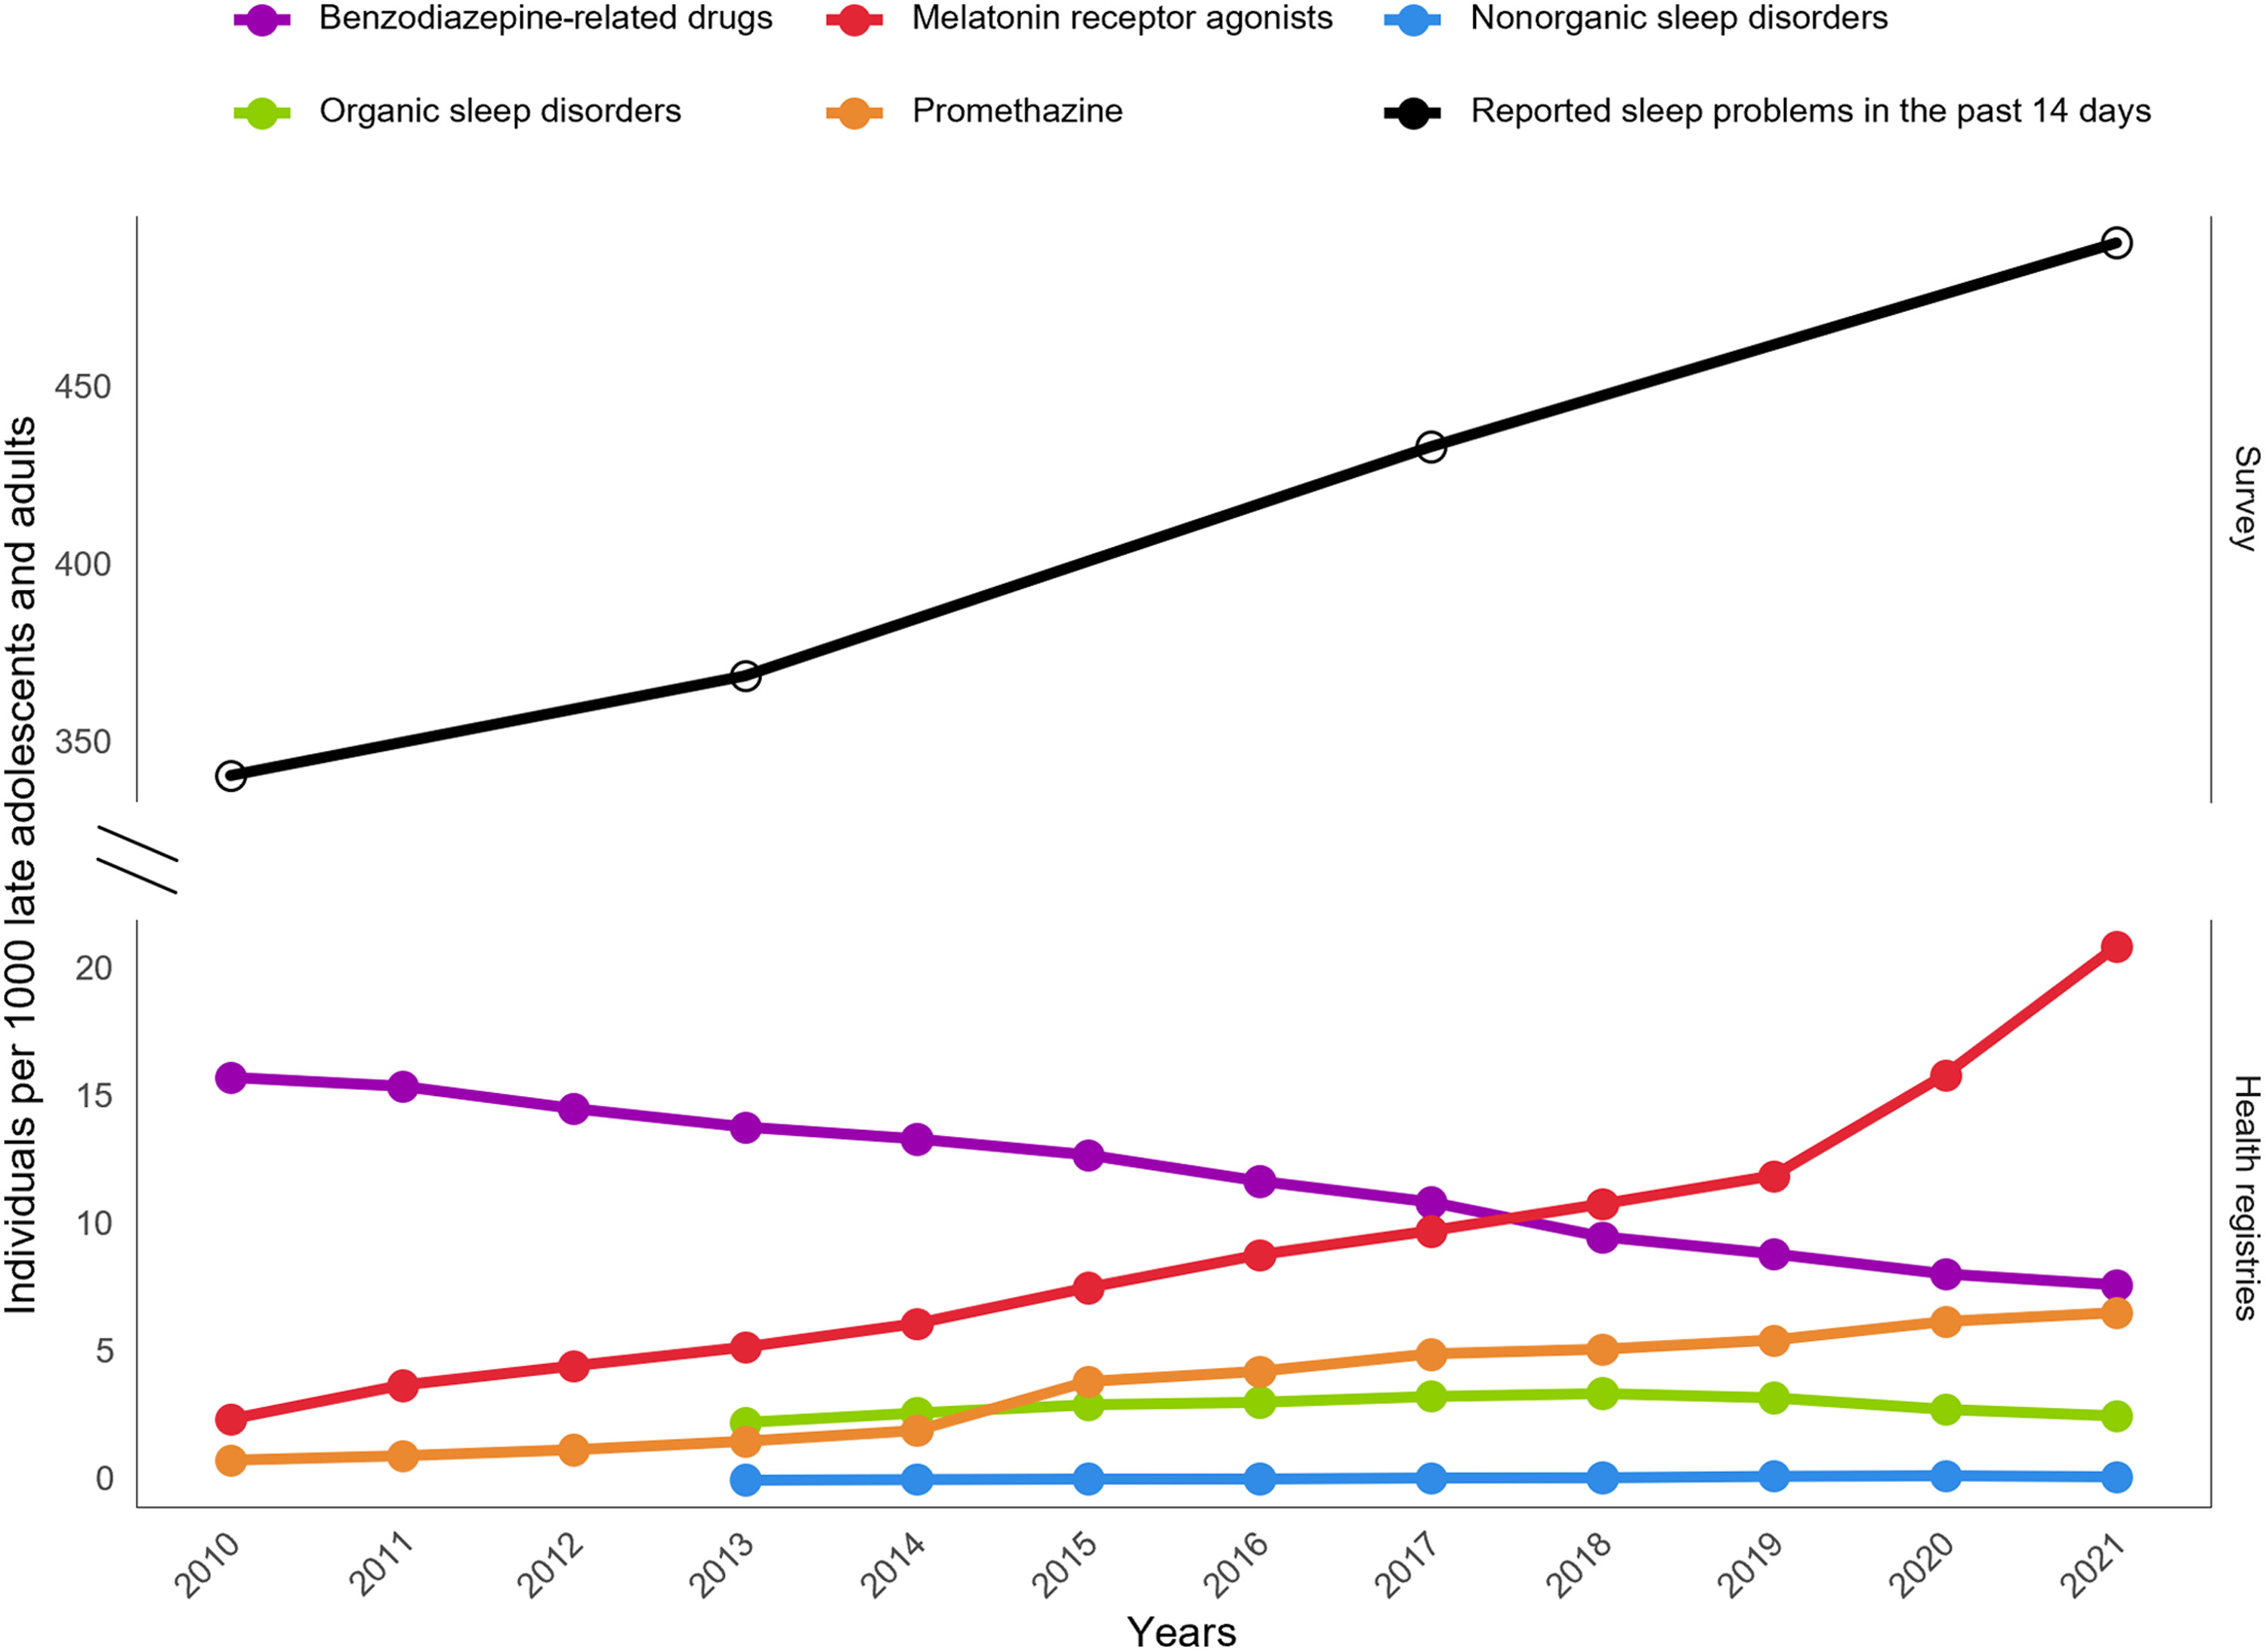
Figure 9: Sleep problems
Youth Mental Health
One of the most concerning trends of the past 15 years is the sharp increase in internalizing disorders—chiefly depression and anxiety—among young people. This rise marks a distinct break from the relatively stable trends of the early 2000s and appears to be a widespread phenomenon across the developed world.
Young females seem to be particularly affected, with large increases in self-harming and self-reported anxiety and depression.
The ease of access to social media websites via smartphones seems to line up with these rises in behaviour.
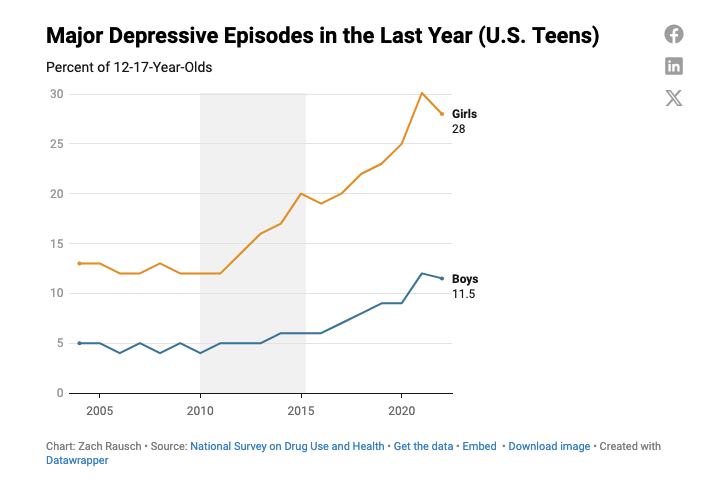
Figure 10: Youth Depression
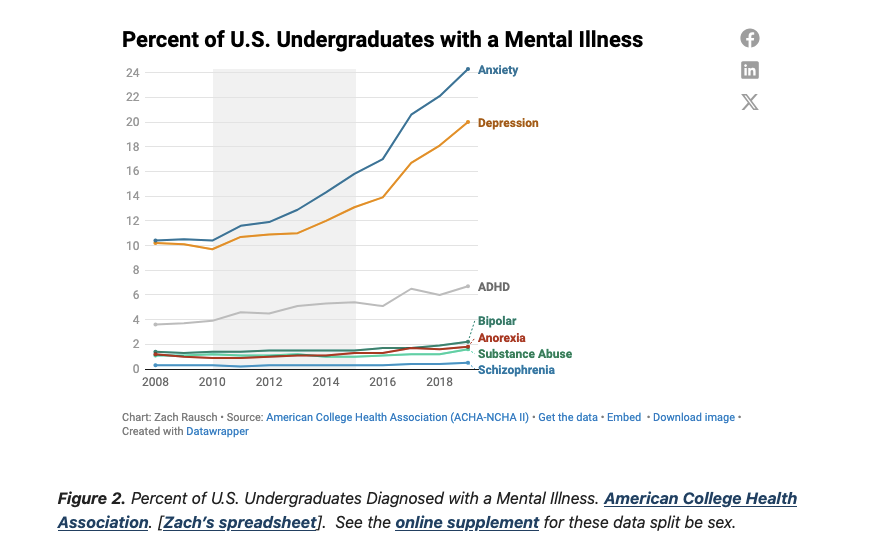
Figure 11: Youth Depression
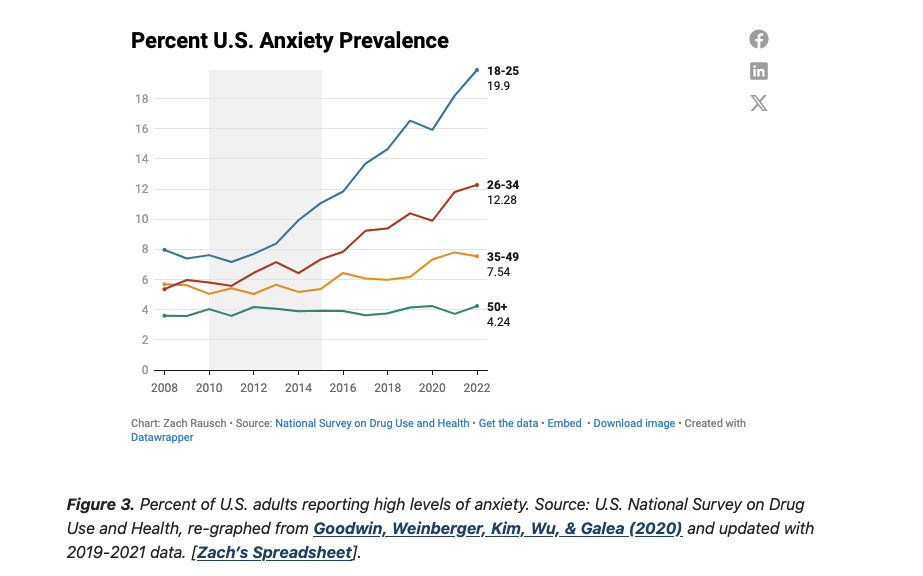
Figure 12: Youth Depression
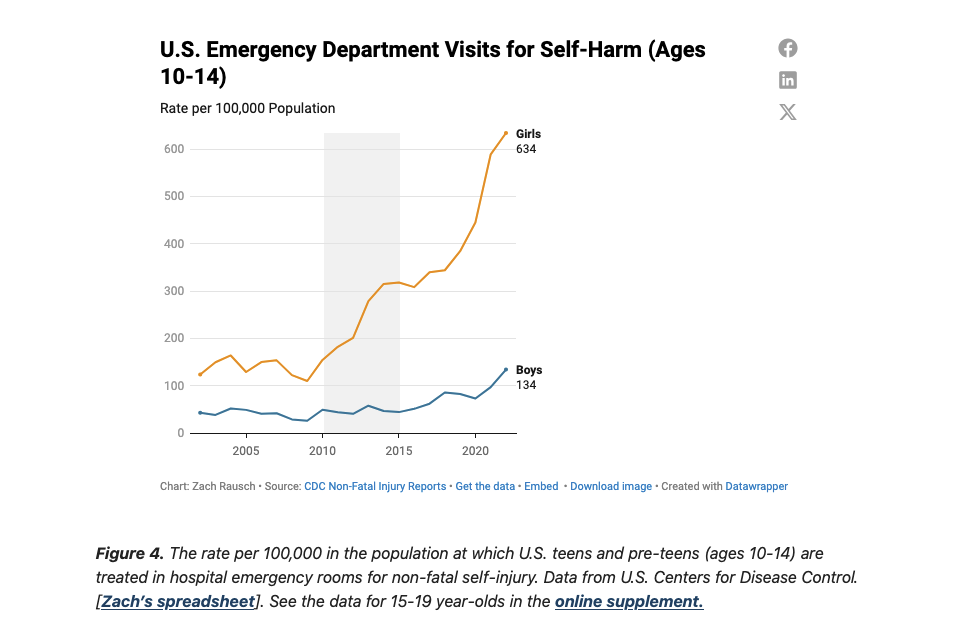
Figure 13: Youth Depression
Sources:
Mental Health Disorders
Since 2007 in the UK: – Some 10.3% of adults reported ever having self-harmed, more than four times the 2.4% reported in the year 2000 and up from 3.8% in 2007 and 6.4% in 2014. – The proportion of those reporting self-harm was highest among 16 to 25-year-olds (24.6%), with more than one in three (31.7%) women in this age group saying they had self-harmed. – The number of adults who told the survey they had experienced suicidal thoughts in the previous 12 months increased from 3.8% in 2000 to 6.7% in 2023/24. These thoughts were highest among 25 to 34-year-olds (32.9%). – The proportion of adults who reported attempting suicide also doubled from 0.5% in 2000 to 1% in the latest survey.
Sources:
Loneliness
Survey data consistently identifies young adults as the demographic most acutely affected by loneliness. One comprehensive survey found that 61% of young adults in the U.S. aged 18 to 25 identified as "seriously lonely". Globally, the figures are similarly high, with one study finding that 27% of young adults aged 19 to 29 experience feelings of loneliness. When compared generationally, the contrast is stark. One report found that 80% of Generation Z individuals (born roughly 1997-2012) reported feelings of isolation over the past year, significantly higher than the 72% of Millennials and 45% of Baby Boomers who said the same
Sources:
Productivity
Economic productivity, specifically labour productivity (output per hour worked), is the primary driver of long-term improvements in living standards.
After a period of growth in the late 1990s and early 2000s, labour productivity growth is slowing following the 2007-2009
The Great Recession and COVID are obviously huge drivers of lost productivity, but it stands to reason that if we're sleeping less, are more depressed, and have less socially active lives, our productive output will suffer in some way.
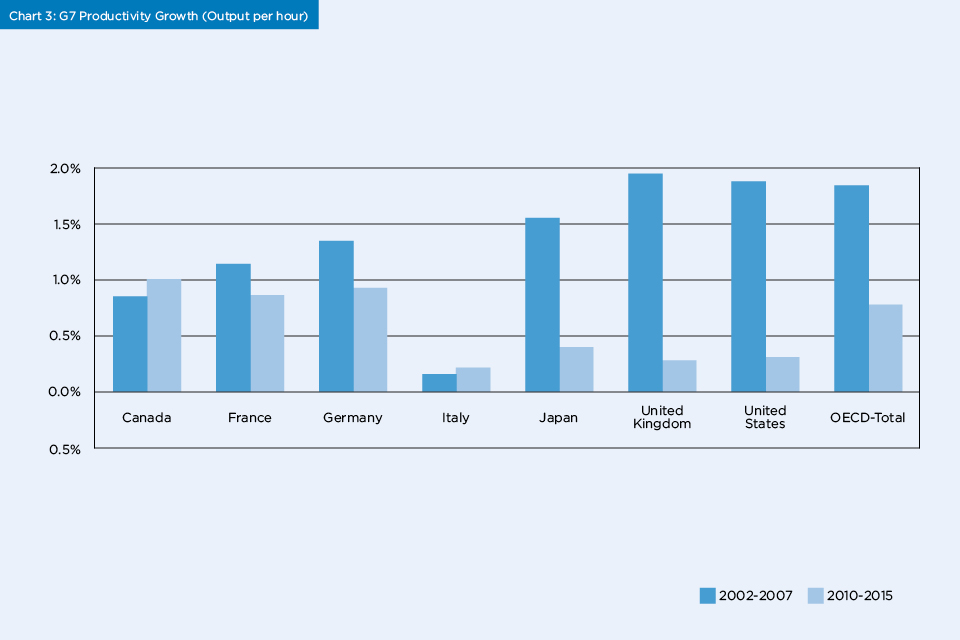
Figure 14: World Productivity
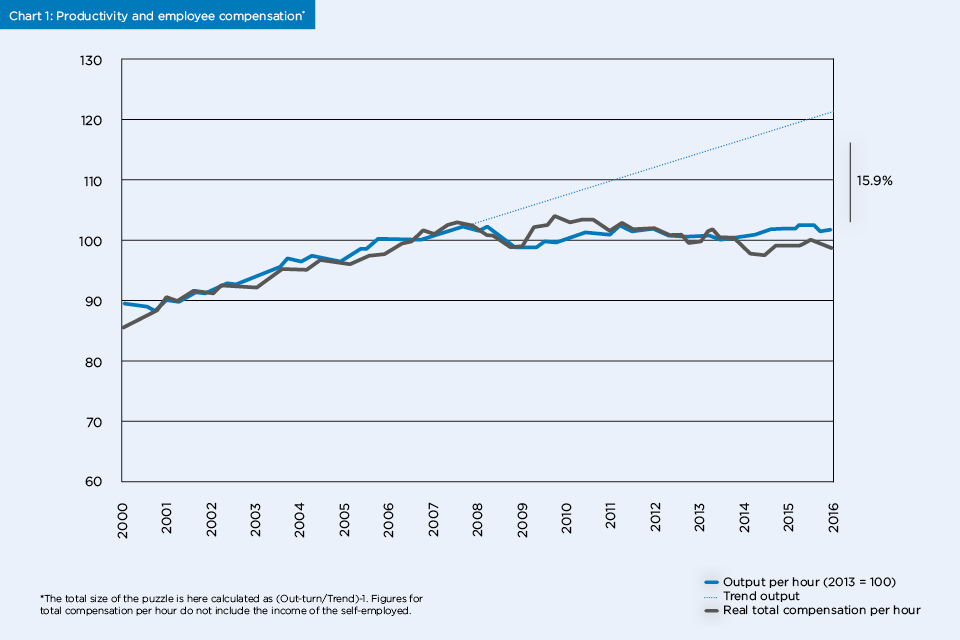
Figure 15: UK Productivity
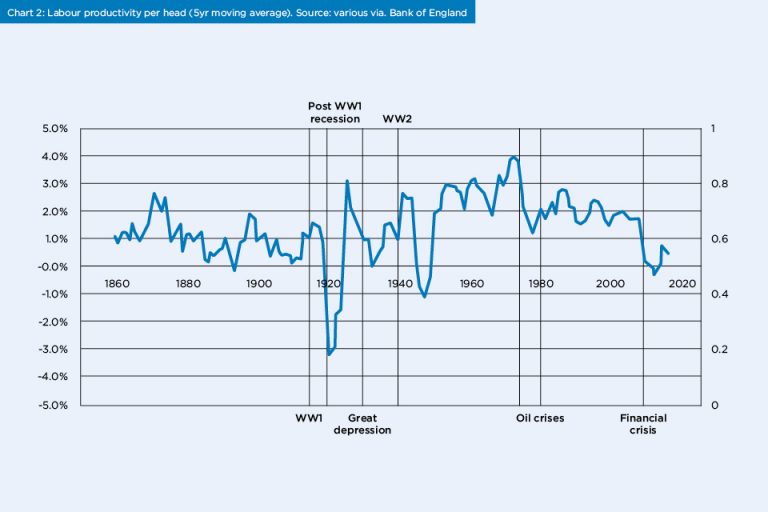
Figure 16: UK Productivity
Road Traffic Accidents

Figure 17: Pedestrian Deaths Per Billion vehicle miles
Sources:
- https://www.economist.com/graphic-detail/2019/05/13/smartphones-are-driving-americans-to-distraction
Smartphones grab our attention so powerfully that if they merely vibrate in our pockets for a tenth of a second, many of us will interrupt a face-to-face conversation, just in case the phone is bringing us an important update.
— Jonathan Haidt, The Anxious Generation: How the Great Rewiring of Childhood Is Causing an Epidemic of Mental Illness
Is the iPhone Birth Control?
https://www.nber.org/papers/w35310
The U.S. general fertility rate has fallen by 22% since 2007, a sustained decline not readily explained by economic conditions, contraceptive use, housing or childcare costs, or other commonly cited factors.
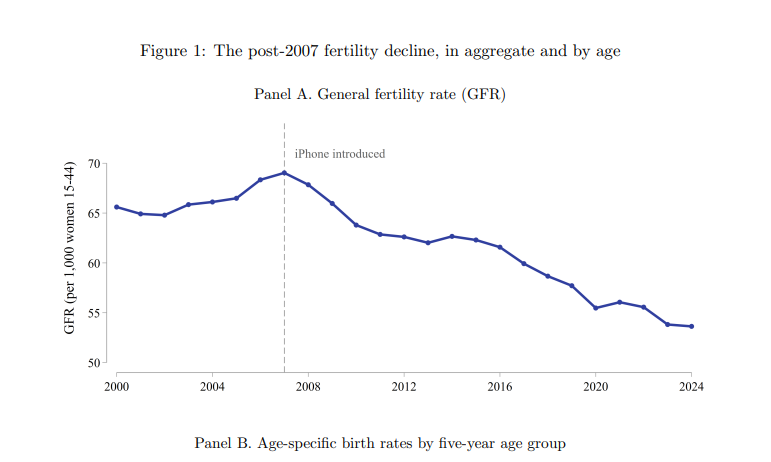
Figure 18: US Fertility
Other people talking about it being the phones
Matt Walsh
My theory: two things happened in 07/08 that explain the drop off. The first is Obama's election. The era of wokeness began and killed all forms of risky or provocative artistic expression, at least in the mainstream.
The second and far more important factor is the release of the first iPhone in 2007 and the rise of social media at the same time. That was the death of the monoculture, our shared cultural experience. Now the culture is fragmented into a million pieces, driven by algorithms which are designed to feed us a nonstop diet of lowest common denominator slop.
There's a reason why music peaked a little bit earlier than movies and television. The fragmenting of the music industry began with Napster and file sharing services almost a decade before. The music monoculture had already mostly died by the time movies and TV were peaking. By 2012 it was over.